SAP Crystal Reports
Enables customers to easily design and deliver meaningful interactive business reports connected to virtually any data source.
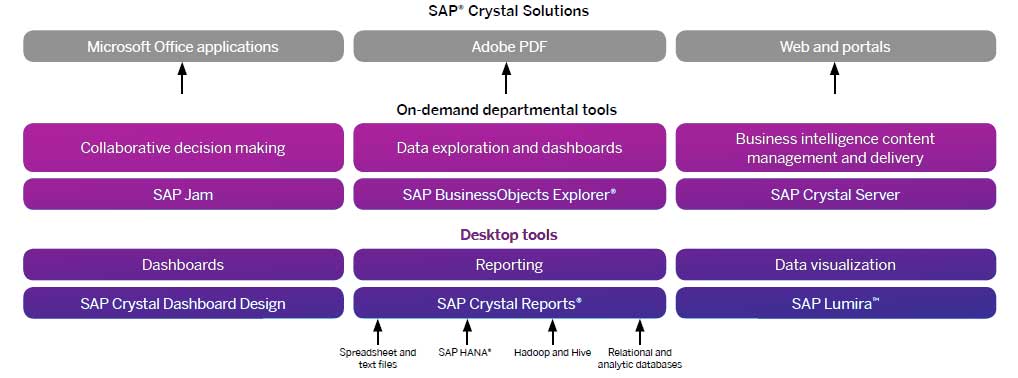
Optimize Decisions with SAP Crystal Solutions
Decision makers trying to improve business performance require reliable, timely information. With integrated reporting, dashboard, presentation, and analysis solutions, SAP® Crystal solutions can help you gain broader insight, perform root cause analysis, and monitor business performance in real time. Ondemand software from SAP further optimizes decision making by letting you improve collaboration and share secure business intelligence online – for faster, smarter business decisions.
Drive Faster, More Intelligent Business Decisions
Most business reports today are pieced together from many data sources, including e-mails, spreadsheets, and databases. Yet despite the multitude of sources, often there is not enough data – or too many conflicting “versions of the truth” – to make the quick, confident decisions that today’s hypercompetitive environment demands. Even when data is available, it is either outdated or presented in a static format that decision makers must transpose into a spreadsheet for further analysis.
Improve Agility with SAP Crystal Dashboard Design
Monitor Business Performance and Drill to Detail
Business decisions often require immediate action, so waiting for information is not an option. SAP Crystal Dashboard Design offers a simple yet effective way for your decision makers to gain immediate insights into critical business data and take action to improve business performance. It includes interactive dashboard and visualization software designed to provide simplified, at-a-glance data views (as presented in Figure 4) for strategic decision making and the ability to drill to detail for root cause analysis. SAP Crystal Dashboard Design provides executives and business professionals with a personalized view of the business with role-based security and what-if scenario functionality to model potential business outcomes.
With SAP Crystal Dashboard Design, you can create HTML5 or Adobe Flash dashboards from Microsoft Excel spreadsheets or live data sources. It offers a feature- rich library of ready-to-use charts, maps, gauges, progress bars, and more for creating interactive and engaging data visualizations. Its point-and-click interface lets you quickly connect prebuilt charts and graphics to personal data in spreadsheets or live company data via XML data feeds or Web services. You can then deliver the charts and graphics live as part of Microsoft Office, Adobe PDF, Adobe Flash (SWF file format), and Adobe AIR, as well as through Web and mobile applications. The result is an interactive dashboard with live data connectivity for accurate, consistent information, providing you with immediate and trusted results. The dashboards can be accessed not only on desktops and laptops, but also on mobile devices such as tablets and smartphones.
Search and Explore Your Business Data – Anytime, Anywhere
Explore Data at the Speed of Thought with SAP BusinessObjects Explorer
Get immediate answers to your pressing business questions. SAP BusinessObjects Explorer combines the simplicity and speed of an Internet search with the analytical power of business intelligence – for faster, more informed decision making.
A metadata layer replaces obscure database terms with consistent business terms while maintaining data source connections and relationships, so you can be confident you have an accurate and shared view of the business
SAP BusinessObjects Explorer software gives you richer information in context, using visualizations, mashups, and geolocation enrichments to illuminate your data. Designed for ease of use, the software helps your business users quickly unlock data hidden in transactional systems and discern patterns and trends to discover immediate answers to their questions – all without relying on assistance from IT.
With SAP BusinessObjects Explorer, you
can give all of your users the autonomy to:
Search and discover the information
they need, using keyword searches
that require no set workflow, query
building, or data model knowledge
Share dashboards and visualizations
with peers, using simple point-andclick
data exploration to build sharable
dashboard views in a self-service way
– without IT’s help
Enable ad hoc exploration everywhere,
not just on the desktop, exploring data
online and offline on mobile devices
(see Figure 5); anyone can tap, swipe,
and zoom their way to business
answers from any location
Leverage the Power of Your Business Intelligence
Collaborate and Share Business Intelligence Online
With SAP Crystal solutions, you can realize the following business benefits:
- Enable broader business insight by delivering current and accurate information to all business users
- Support sound decision making with an intuitive user interface for ad hoc business questions
- Spot trends early by monitoring performance and drilling to detail
- Reduce IT cost by automating the delivery of the right information to the right people at the right time
Team Up for Successful Problem Solving with SAP Jam
SAP Jam provides a social collaboration environment that enables teams to perform collective problem solving. You can bring order to chaos by involving and keeping everyone on the same page with notifications, blogs, wiki pages, and comments and discussions. With proven, interactive tools from the built-in catalog, you can plan agendas, assign responsibilities, rank lists of items, brainstorm options, poll the team, or strategize using strength, weakness, opportunity, and threat (SWOT) analysis.
Additionally, you can upload and share information to help ensure your team is making the best decisions based on the latest facts – and you can develop and analyze hypotheses using intuitive data exploration and visualization. You can even collaborate using different mobile devices such as tablets and smartphones. And once the decision is made, you can create a corporate memory that contains all participants, discussions, information, feedback, methods, and the final decision – all in a single place.